Featured

9 SEO Experts on the Future of Marketing

9 SEO Experts on the Future of Marketing

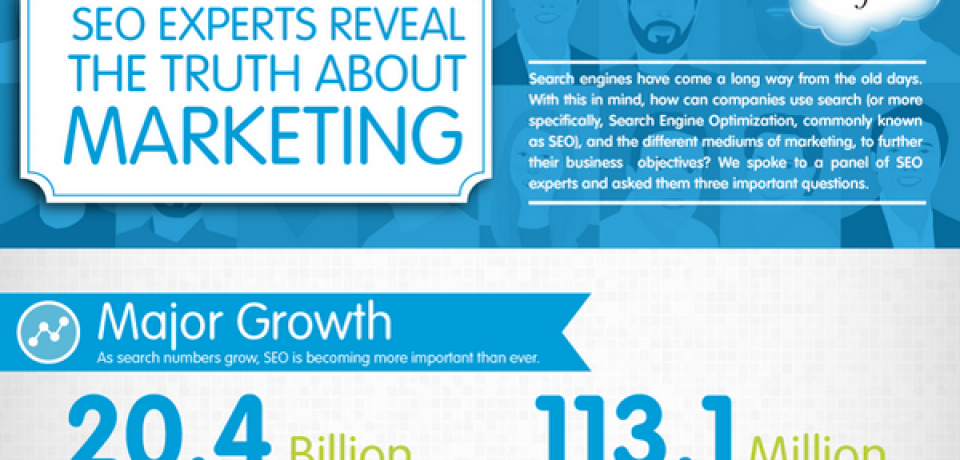
Marketing is a twisted, winding road, with many dead ends. Website content, along with social network marketing, are two ways to ensure that you stay in tune with your customers. As soon as search engine optimization (SEO) is mentioned, however, many marketers run the other direction. With so much mis-information out there about SEO, what […]

Difference Between Online and Offline Leads

Difference Between Online and Offline Leads

No matter your market, sales leads come from two very important-but vastly different-sources. Online leads, or offline leads. While both of these lead streams are vital to the success of business, many businesses are handling these leads in a “One size fits all” manner. www.salesforce.com has created an infographic entitled “The Differences between Online, Offline […]

What People Think I Do [Infographic]

What People Think I Do [Infographic]

Over an average year, a stay at home mom spends 15,000 hours on childcare, 8,000 hours on cooking, 6,000 hours on laundry, and 11,000 hours cleaning/fixing the house. This averages out to about 94 hours per week of work-hardly enough time to sit around all day watching soaps! And with a preschooler, sitting through an […]

Home Health Hacks

Home Health Hacks

From treating stinky feet with water spiked with vodka, to curing a migraine with peppermint oil, this infographic details proven life-hacks that really work. For example, gargling salt water three times a day will cut healing time for a respiratory infection by 40%. One of life’s most irritating problems, the hiccups, can be alleviated by […]

Learning Disabilities

Learning Disabilities

Chances are, you or someone you know has been diagnosed with some type of learning disability. It is estimated that 4-6% of the population in the United States has some type of learning disability.  While many view these individuals as lacking in intelligence, this couldn’t be further from the truth. www.special-education-degree.net has created an infographic detailing the statistics […]

Evolution of Cellphones [Infographic]

Evolution of Cellphones [Infographic]

Cell phones were first invented back in 1973,with the first cell phone available to the public being the $3,995 Motorola DynaTac in 1983.  Fast-forward to 2013, and there are 3.5 million cell phone users-including you! www.computersciencedegreehub.com has created an infographic explaining the history of the cell phone, the most popular models, and the top companies in the cell […]

Saving on College [Infographic]

Saving on College [Infographic]

There’s no two ways about it: College is expensive.  From books and supplies to rent and tuition, students are struggling with more debt than ever before.  An average college degree costs $88,000, and leaves a student $23,000 in debt.  With $1 trillion in outstanding student loans across the nation, it’s no surprise that college enrollment is on the decline. […]

Eye-Opening Statistics About Men and Sex [Infographic]

Eye-Opening Statistics About Men and Sex [Infographic]

Attention all women! Ever wonder what men are really thinking? While most women believe they’ve got men pegged down to a T (anything involving beer, buffalo wings and breasts generally spring to mind), it’s about time we delve a little bit deeper. What really goes on behind the inner workings of the male mind? Do […]